Introduction
Objectives
Understand why Graph Neural Networks are suited for AIS vessel classification
Learn what the three GNN architectures (GCN, GraphSAGE, GAT) offer
Know the project objectives and repository structure
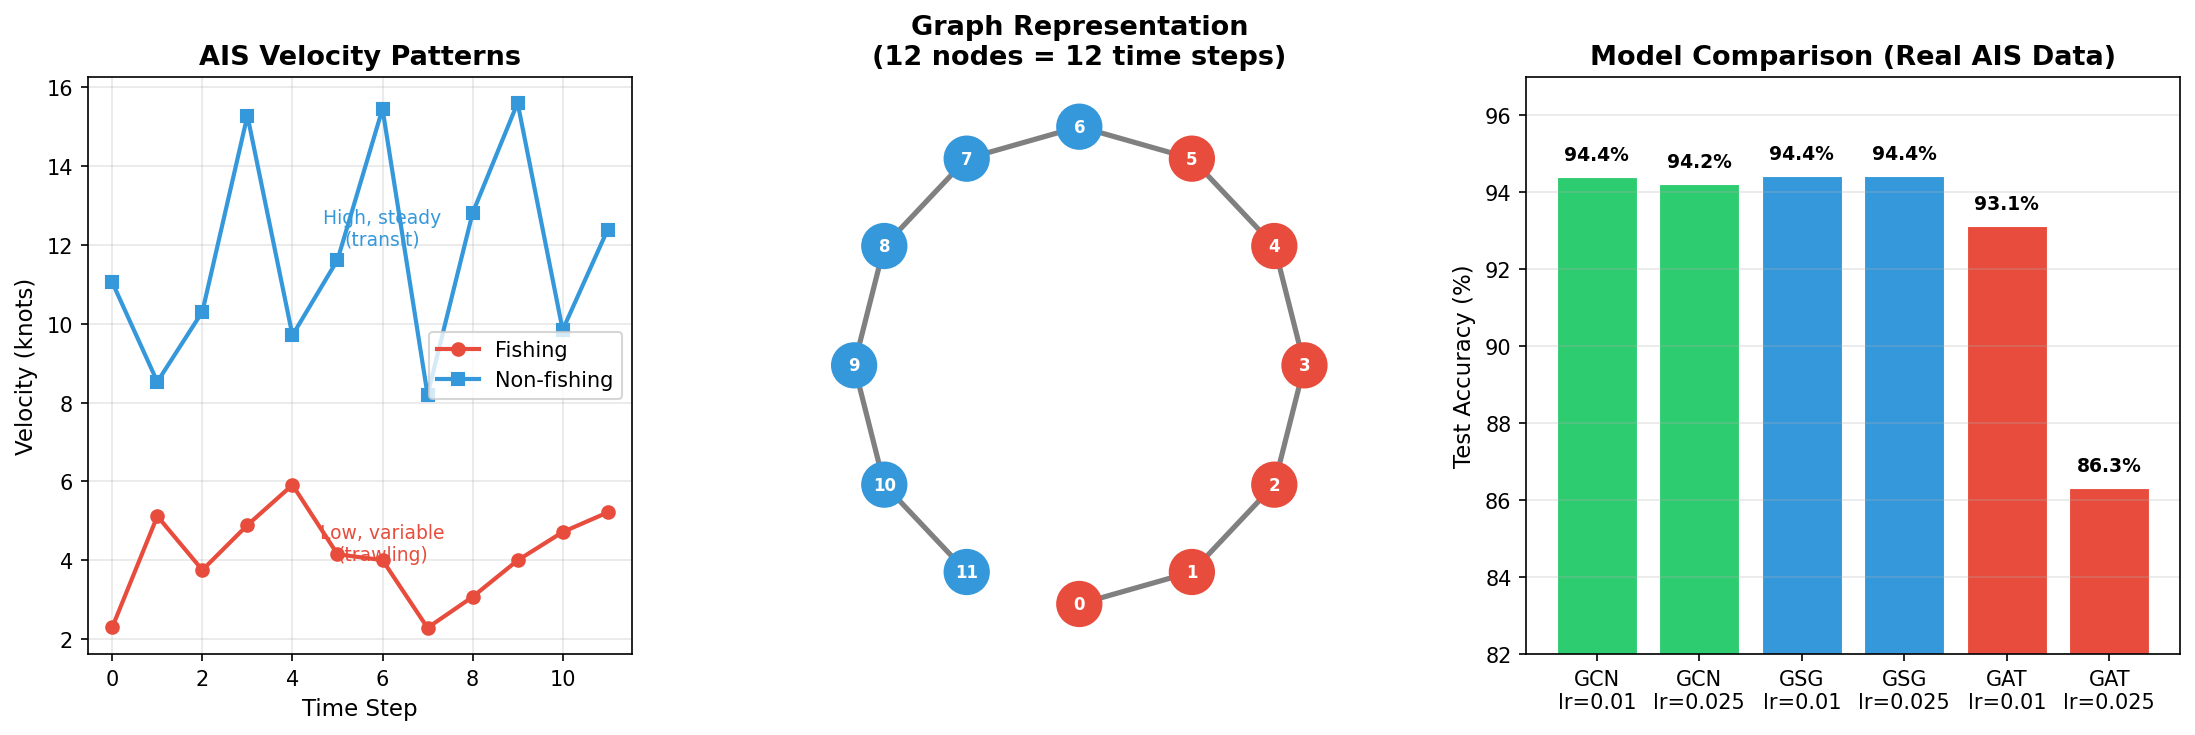
Understand the graph representation of AIS time-series data
Why This Matters
The Scenario: A marine biologist monitoring Norway’s coastal waters needs to identify illegal fishing activity from satellite AIS feeds. She receives thousands of vessel tracks per day – each a time-series of position, speed, and heading. Manual inspection is impossible at scale, and traditional rule-based methods (speed thresholds, zone boundaries) fail when vessels use complex trajectories to disguise fishing behavior. She needs an automated system that can learn the subtle movement patterns that distinguish fishing from transit.
The Challenge: Fishing vessels do not follow a single movement template. Some trawl in straight lines at low speed, others circle around fish aggregation devices, and some drift with currents. A classifier must capture these diverse temporal patterns and the relationships between consecutive observations – something that flat feature vectors struggle with.
What This Episode Gives You: The big picture – how AIS time-series data is converted to graphs, why GNNs are a natural fit for this structure, and what the three architectures bring to the table.
Overview
This demonstrator shows how Graph Neural Networks can classify vessel behavior from AIS (Automatic Identification System) time-series data. By representing each vessel trajectory as a graph, the model learns to distinguish between fishing and non-fishing activities with over 94% accuracy.
Overview of the GNN-based AIS classification pipeline: raw vessel trajectories are converted to graph structures, processed by GNN layers, and classified as fishing or non-fishing.
Background
The Automatic Identification System (AIS) provides real-time information about vessel movements, including position, speed, heading, and course. By analyzing patterns in vessel movement data, we can distinguish between fishing and non-fishing activities.
Traditional approaches rely on hand-crafted features and thresholds. For example, a simple rule might flag vessels moving below 5 knots near the coast as fishing. However, these rules break down with complex trajectories – a vessel may slow down for navigation, or fish at higher speeds using pelagic trawls. This demonstrator shows how Graph Neural Networks can automatically learn these patterns from the data by representing time-series as graph structures.
Why Graphs?
Converting time-series to graphs offers several advantages over flat feature vectors:
Structural encoding: The chain graph naturally captures temporal ordering and adjacency between observations
Message passing: Each node (time step) aggregates information from its neighbors, building context-aware representations
Permutation-aware pooling: Graph readout functions produce fixed-size embeddings regardless of sequence length
Extensibility: The graph structure can be enriched with additional edges (e.g., connecting nodes with similar features) without changing the model architecture
Architecture Overview
Each AIS time-series sample consists of 12 time steps with 3 features:
Velocity – the speed of the vessel
Distance to shore – proximity to the coastline
Curvature – trajectory curvature indicating turns
These are converted to graphs where:
Nodes represent time steps (12 nodes per graph)
Edges connect consecutive time steps (chain structure)
Self-loops are added so each node receives its own features during message passing
Node features are the 3-dimensional feature vectors at each time step
Three GNN Architectures
This demonstrator compares three established GNN architectures:
Architecture |
Key Idea |
Strengths |
|---|---|---|
GCN (Graph Convolutional Network) |
Spectral convolution with normalized Laplacian |
Simple, well-understood, strong baseline |
GraphSAGE (GSG) |
Sample-and-aggregate with mean pooling |
Scalable, inductive learning, consistent performance |
GAT (Graph Attention Network) |
Multi-head attention over neighbors |
Learns which connections matter, flexible weighting |
GraphSAGE achieves the best overall performance (94.4% accuracy) with consistent results across learning rates. See Episode 04 for the mathematical details of each architecture.
Using AI Coding Assistants
If you are using an AI coding assistant, the repository includes an AGENT.md file with setup instructions. Tell your assistant:
“Read AGENT.md and help me run the AIS GNN classification demonstrator on my NAIC VM.”
The assistant can then guide you through provisioning, setup, training, and evaluation.
Expected Results at a Glance
The best model (GraphSAGE at lr=0.01) classifies ~4,400 out of ~4,700 test trajectories correctly. The full results table is discussed in Episode 06, but here is a preview:
Model |
Test Accuracy |
|---|---|
GCN |
94.4% |
GraphSAGE |
94.4% |
GAT |
93.1% |
These results demonstrate that GNNs can effectively learn vessel behavior patterns from minimal features (3 per time step) without hand-crafted rules.
Self-Contained Repository
Component |
Location |
|---|---|
GNN model definitions |
|
Dataset loader |
|
Training script |
|
Evaluation script |
|
Jupyter notebook |
|
Setup script |
|
What You Will Learn
Episode |
Topic |
|---|---|
02 |
Provisioning a NAIC VM |
03 |
Setting up the environment |
04 |
GNN theory and architectures |
05 |
AIS data and graph construction |
06 |
Running the demonstrator |
07 |
FAQ and troubleshooting |
Note
This is Use Case 5 (UC5) of the NAIC project, developed by NORCE Norwegian Research Centre.
Keypoints
AIS time-series data is converted to chain graphs with 12 nodes and 3 features per node
Three GNN architectures are compared: GCN, GraphSAGE, and GAT
GraphSAGE achieves the best and most consistent performance (94.4% test accuracy)
Graph representation captures temporal structure that flat features miss
The demonstrator runs on NAIC Orchestrator VMs
All code, models, and data loading utilities are included in the repository