Understanding PEM Electrolyzer Data
Objectives
Understand what PEM electrolyzers are and the SWVF technology
Learn about the three NORCE experimental datasets and their characteristics
Know the input features and their physical meaning
Understand data filtering (strict vs minimal) and why it matters
Understand the OOD evaluation protocol and keep-out validation
Why This Matters
The Scenario: A quality assurance engineer at a fuel-cell testing facility receives three batches of polarization curve data from different test campaigns. Some measurements look suspiciously noisy — maybe a sensor was drifting, or a test was interrupted. Before feeding this data into a machine learning model, she needs to know: which data points are trustworthy, and which should be excluded?
The Research Question: How do you systematically detect and exclude contaminated experimental data, and how do you design a validation protocol that proves your model generalizes — rather than just memorizing the training conditions?
What This Episode Gives You: The data pipeline — from raw NORCE measurements to clean, filtered datasets with a rigorous keep-out validation split.
PEM Electrolysis
PEM (Proton Exchange Membrane) electrolyzers produce hydrogen by splitting water using electricity:
Anode: 2H₂O → O₂ + 4H⁺ + 4e⁻
Cathode: 4H⁺ + 4e⁻ → 2H₂
The cell voltage depends on operating conditions: current, pressure, and temperature.
SWVF Technology
The electrolyzer uses Static Water Vapour Feed (SWVF) technology (TRL4), which is fundamentally different from conventional liquid-fed PEM:
Water vapor diffuses through a Water Feed Barrier membrane to the anode
This eliminates liquid water management but adds ionic resistance
The SWVF barrier explains why the learned ohmic resistance (~1.0 Ohmcm2) is higher than typical liquid-fed PEM values (0.05-0.20 Ohmcm2)
This is important context when interpreting the learned physics parameters — the model correctly captures this technology-specific resistance.
NORCE Experimental Data
The data comes from a Proton OnSite M400 electrolyzer stack at the NORCE test facility in Bergen, Norway, consisting of 4 cells with a total active area of 50 cm² (4 x 12.5 cm2).
Available Datasets
Dataset |
Date |
Purpose |
Samples |
Duration |
Description |
|---|---|---|---|---|---|
Test4 |
2024-10-16 |
Training |
~171,838 |
~50 hrs |
Long-term stability, discrete steps, bimodal 15/35 bar |
Test2 |
2024-09-27 |
OOD Evaluation |
~10,603 |
~9 hrs |
Variable current sweep, 0-30 bar range |
Test3 |
2024-09-30 |
OOD Evaluation |
~25,749 |
~10 hrs |
Constant 6A, pressure swap 0-40 bar |
The three test campaigns were conducted under different operating protocols, ensuring the model is evaluated on truly different conditions — not just held-out samples from the same experiment.
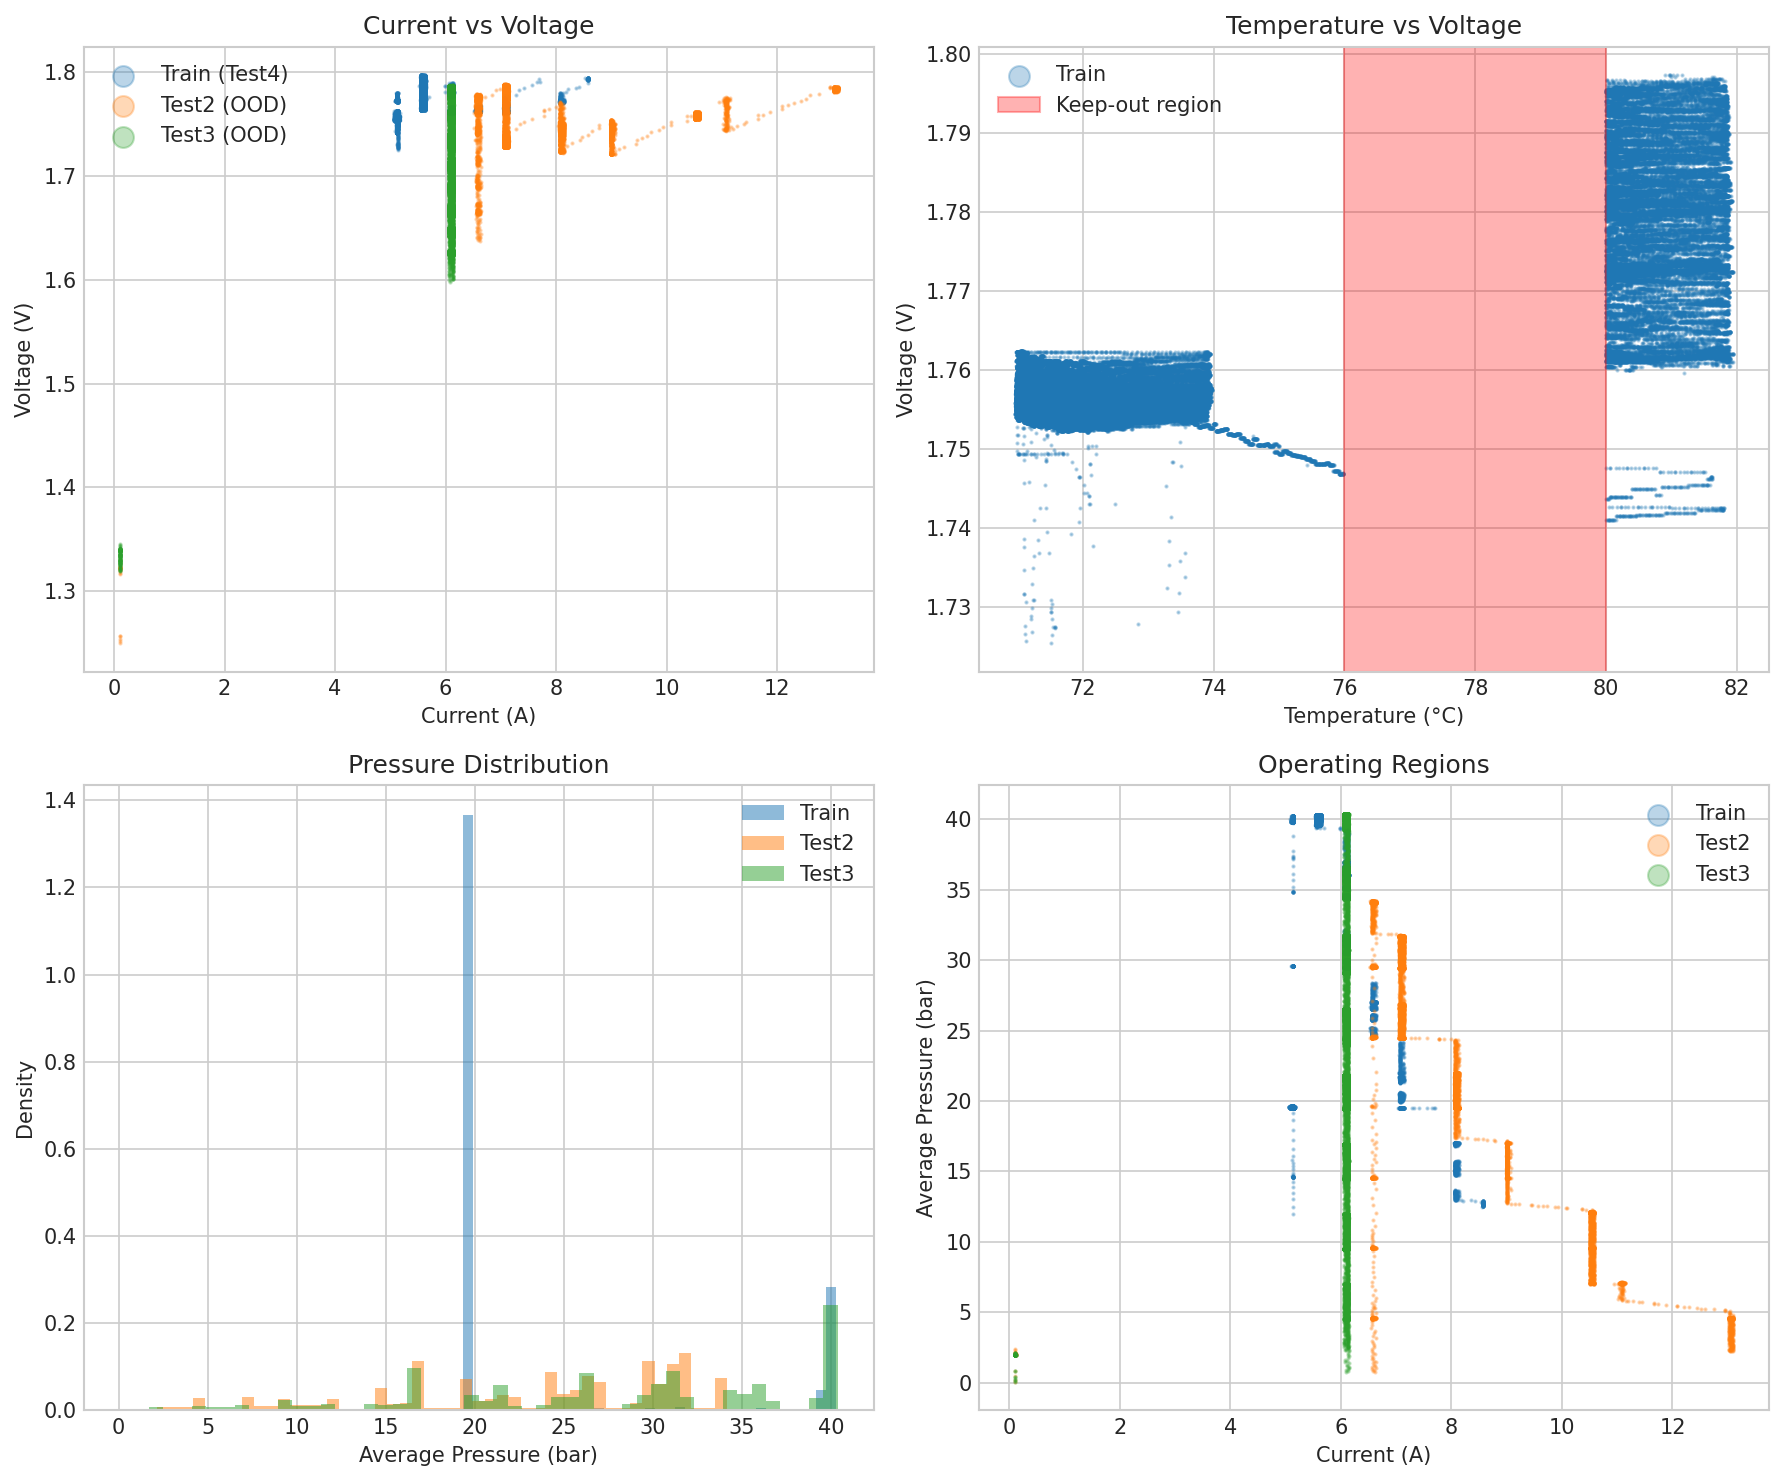
Overview of the NORCE experimental data across the three test campaigns, showing the range of operating conditions covered.
Input Features
Column |
Variable |
Unit |
Description |
|---|---|---|---|
PS-I-MON |
Current |
A |
Stack current (4 cells in series) |
H-P1 |
H₂ Pressure |
bar |
Hydrogen back pressure |
O-P1 |
O₂ Pressure |
bar |
Oxygen back pressure |
T-ELY-CH1 |
Temperature |
°C |
Stack temperature |
CV-mean |
Voltage |
V |
Mean cell voltage (target) |
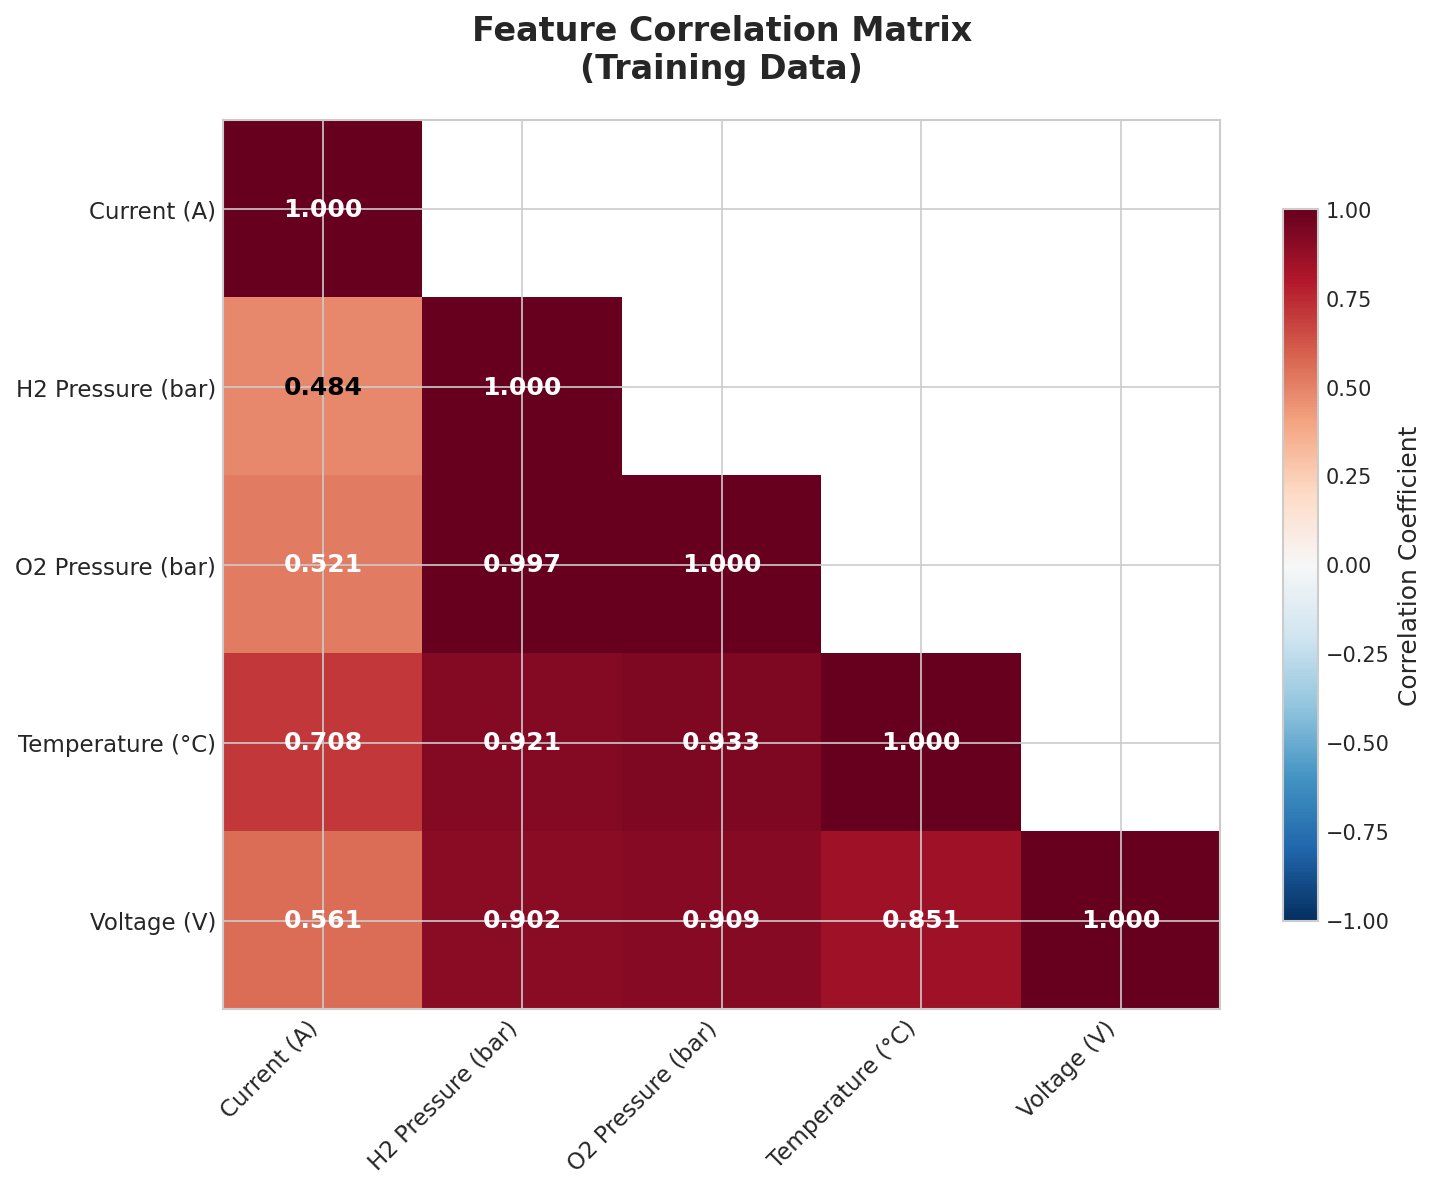
Feature correlation matrix for the training data. Pressure and temperature are strongly correlated with voltage (r > 0.85), while current has moderate correlation (r = 0.56). The near-perfect H₂/O₂ pressure correlation (0.997) reflects symmetric operation.
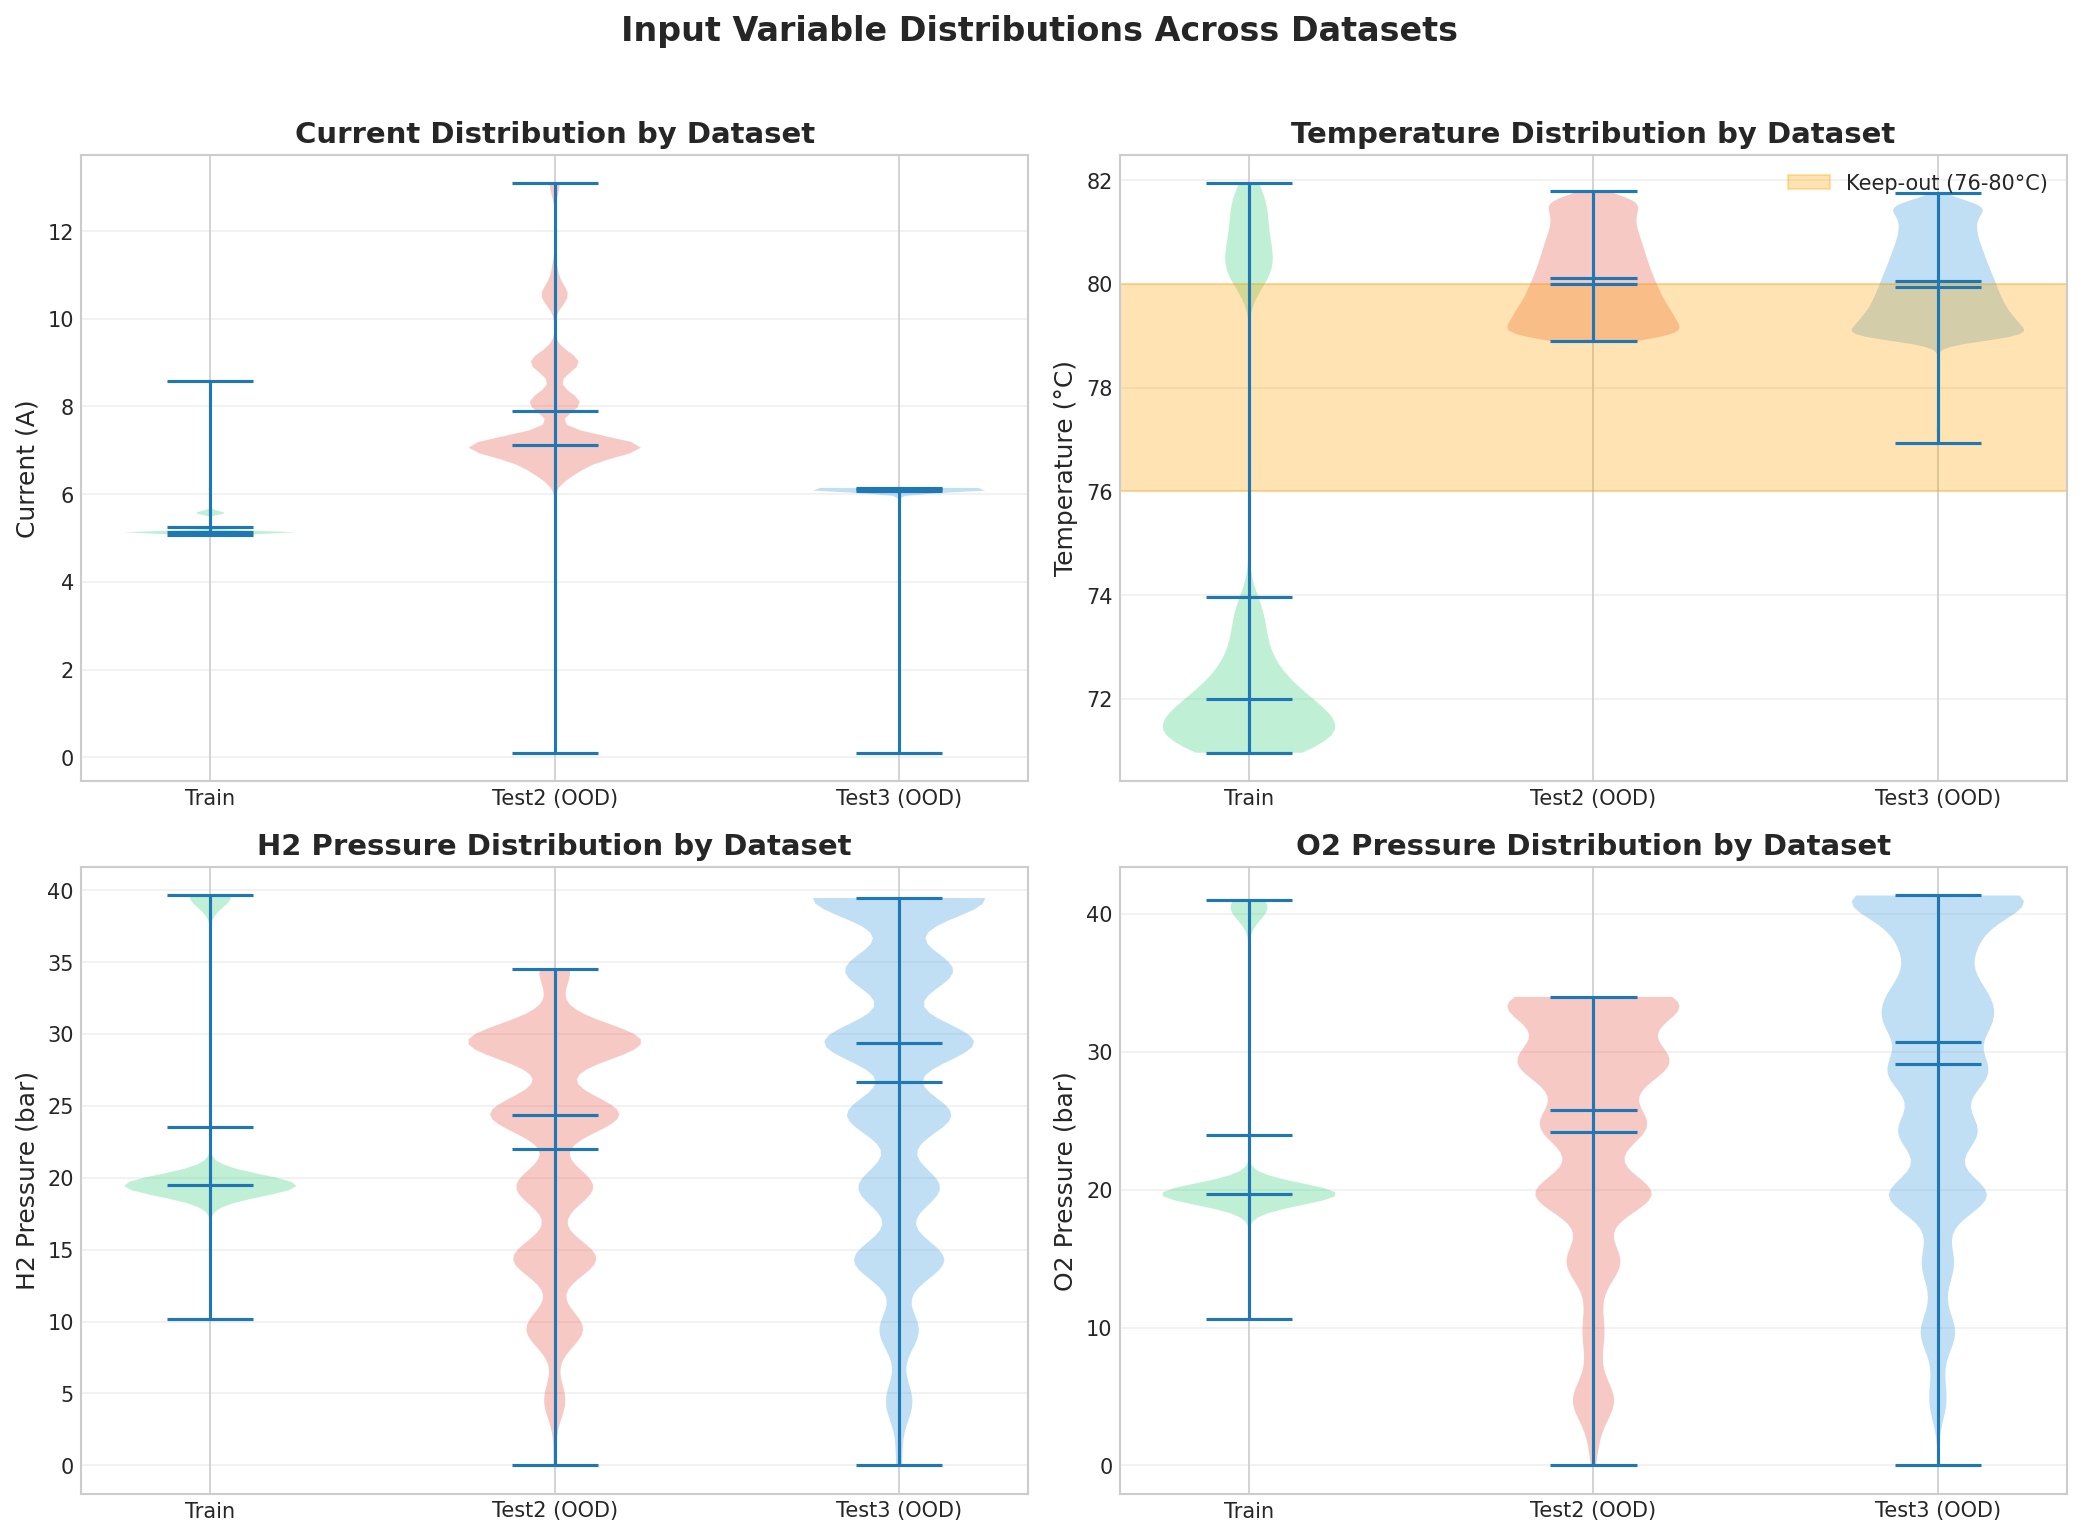
Distribution of input features. Note the non-uniform coverage — the model must extrapolate to operating regimes not seen during training.
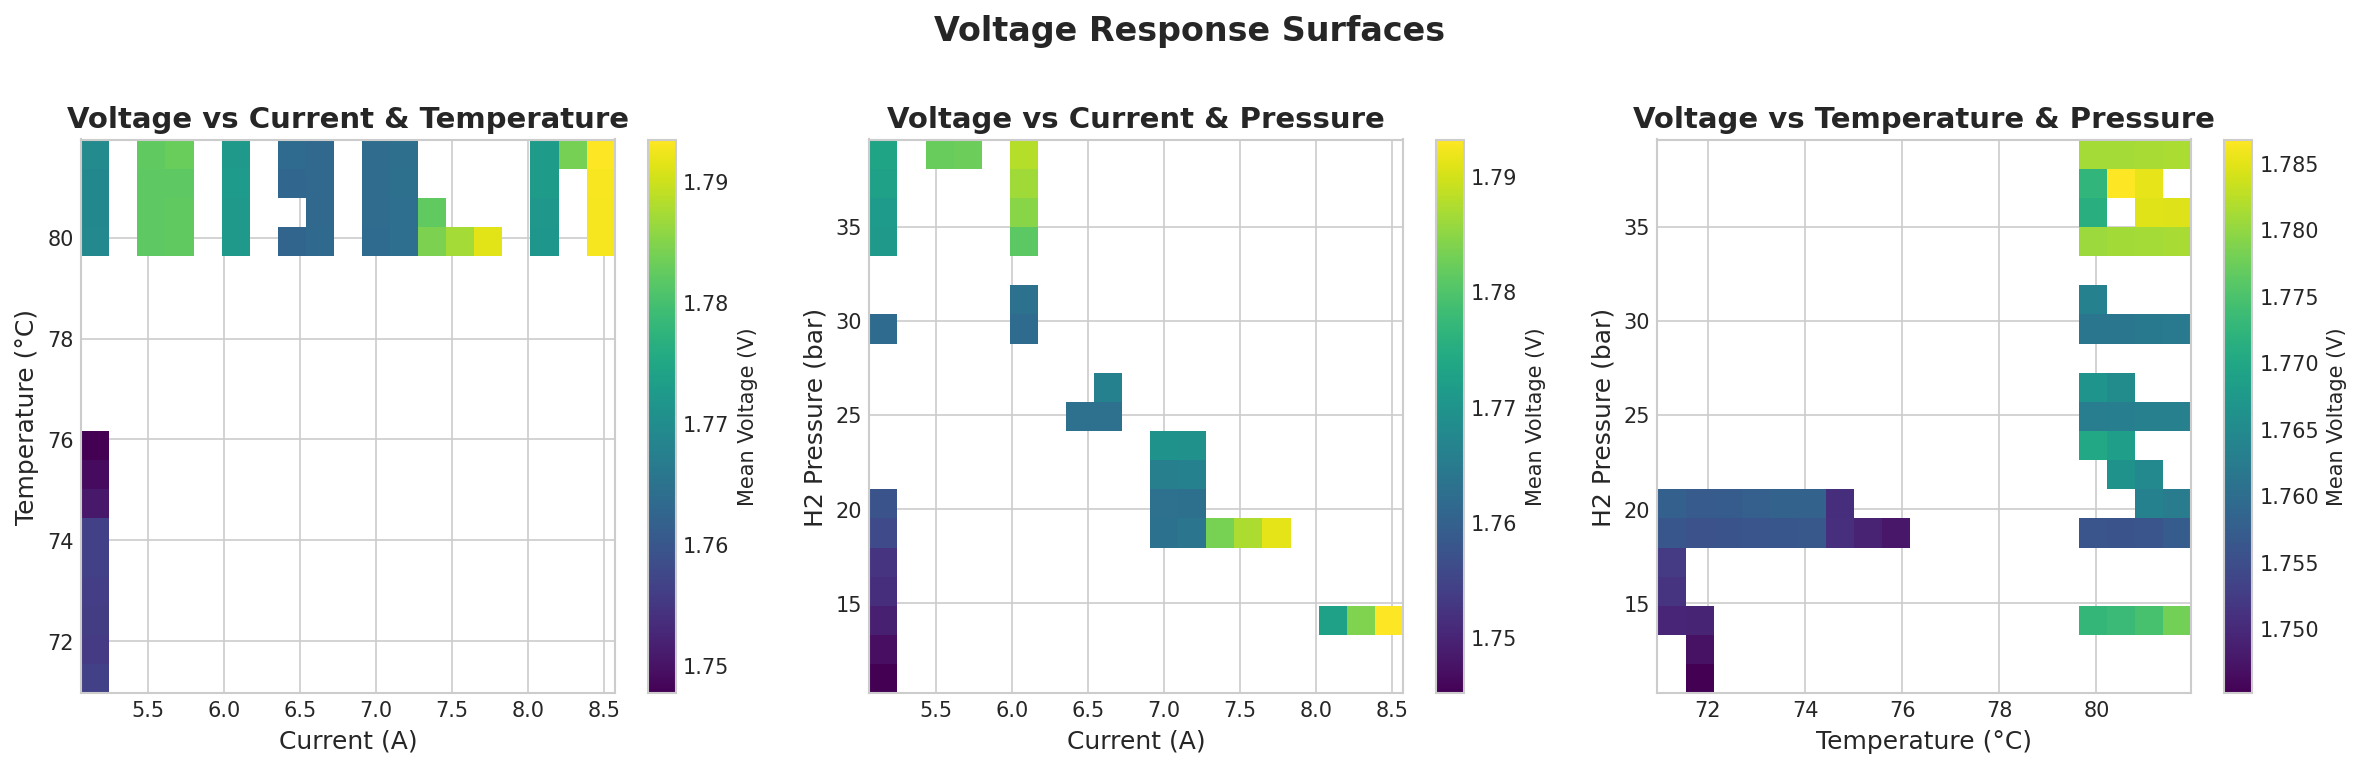
Voltage response surfaces showing the nonlinear relationships: (Left) current vs temperature, (Center) current vs pressure, (Right) temperature vs pressure. Higher current and pressure increase voltage.
Data Filtering
Two filtering levels are used:
STRICT filtering (training data only):
Current ≥ 5 A (exclude low-current transients)
H₂/O₂ pressure > 10 bar (exclude startup/shutdown)
Temperature 70-85°C (operational range)
Voltage 1.5-2.0 V (exclude anomalies)
MINIMAL filtering (OOD evaluation):
Remove NaN values
Remove negative pressures
Remove cold startup (I < 1A AND T < 60°C)
Voltage 1.0-2.5 V
Why Two Filtering Levels?
Strict filtering for training ensures the model learns from clean, steady-state data within the electrolyzer’s nominal operating range. The narrow training window (current > 5A, pressure > 10 bar) means the model never sees low-pressure or low-current data during training.
Minimal filtering for evaluation preserves the full range of operating conditions, including regions entirely absent from training data. This is critical for testing OOD generalization — the model must predict accurately at pressures below 10 bar and currents below 5A despite never training on them.
After strict filtering, only ~7.9% of Test4 raw samples pass (15,234 out of ~193K), because most samples are at low current during ramp-up/down transients.
Out-of-Distribution (OOD) Protocol
Test4 is used for training, while Test2 and Test3 are used for evaluation. These datasets were collected under different operating protocols:
Test2: Systematic current sweeps at varying pressures (0-30 bar) — tests current extrapolation
Test3: Pressure swap experiments at fixed current (6A), 0-40 bar — tests pressure extrapolation
Test4: Long-term stability at various conditions, bimodal 15/35 bar — training data
Key OOD challenges:
Low-pressure regime (< 10 bar): Entirely absent from training data
Pressure range: Training sees bimodal 15/35 bar; Test3 sweeps 0-40 bar continuously
Current patterns: Training uses discrete steps; Test2 uses continuous sweeps
This ensures the model is evaluated on truly unseen operating conditions.
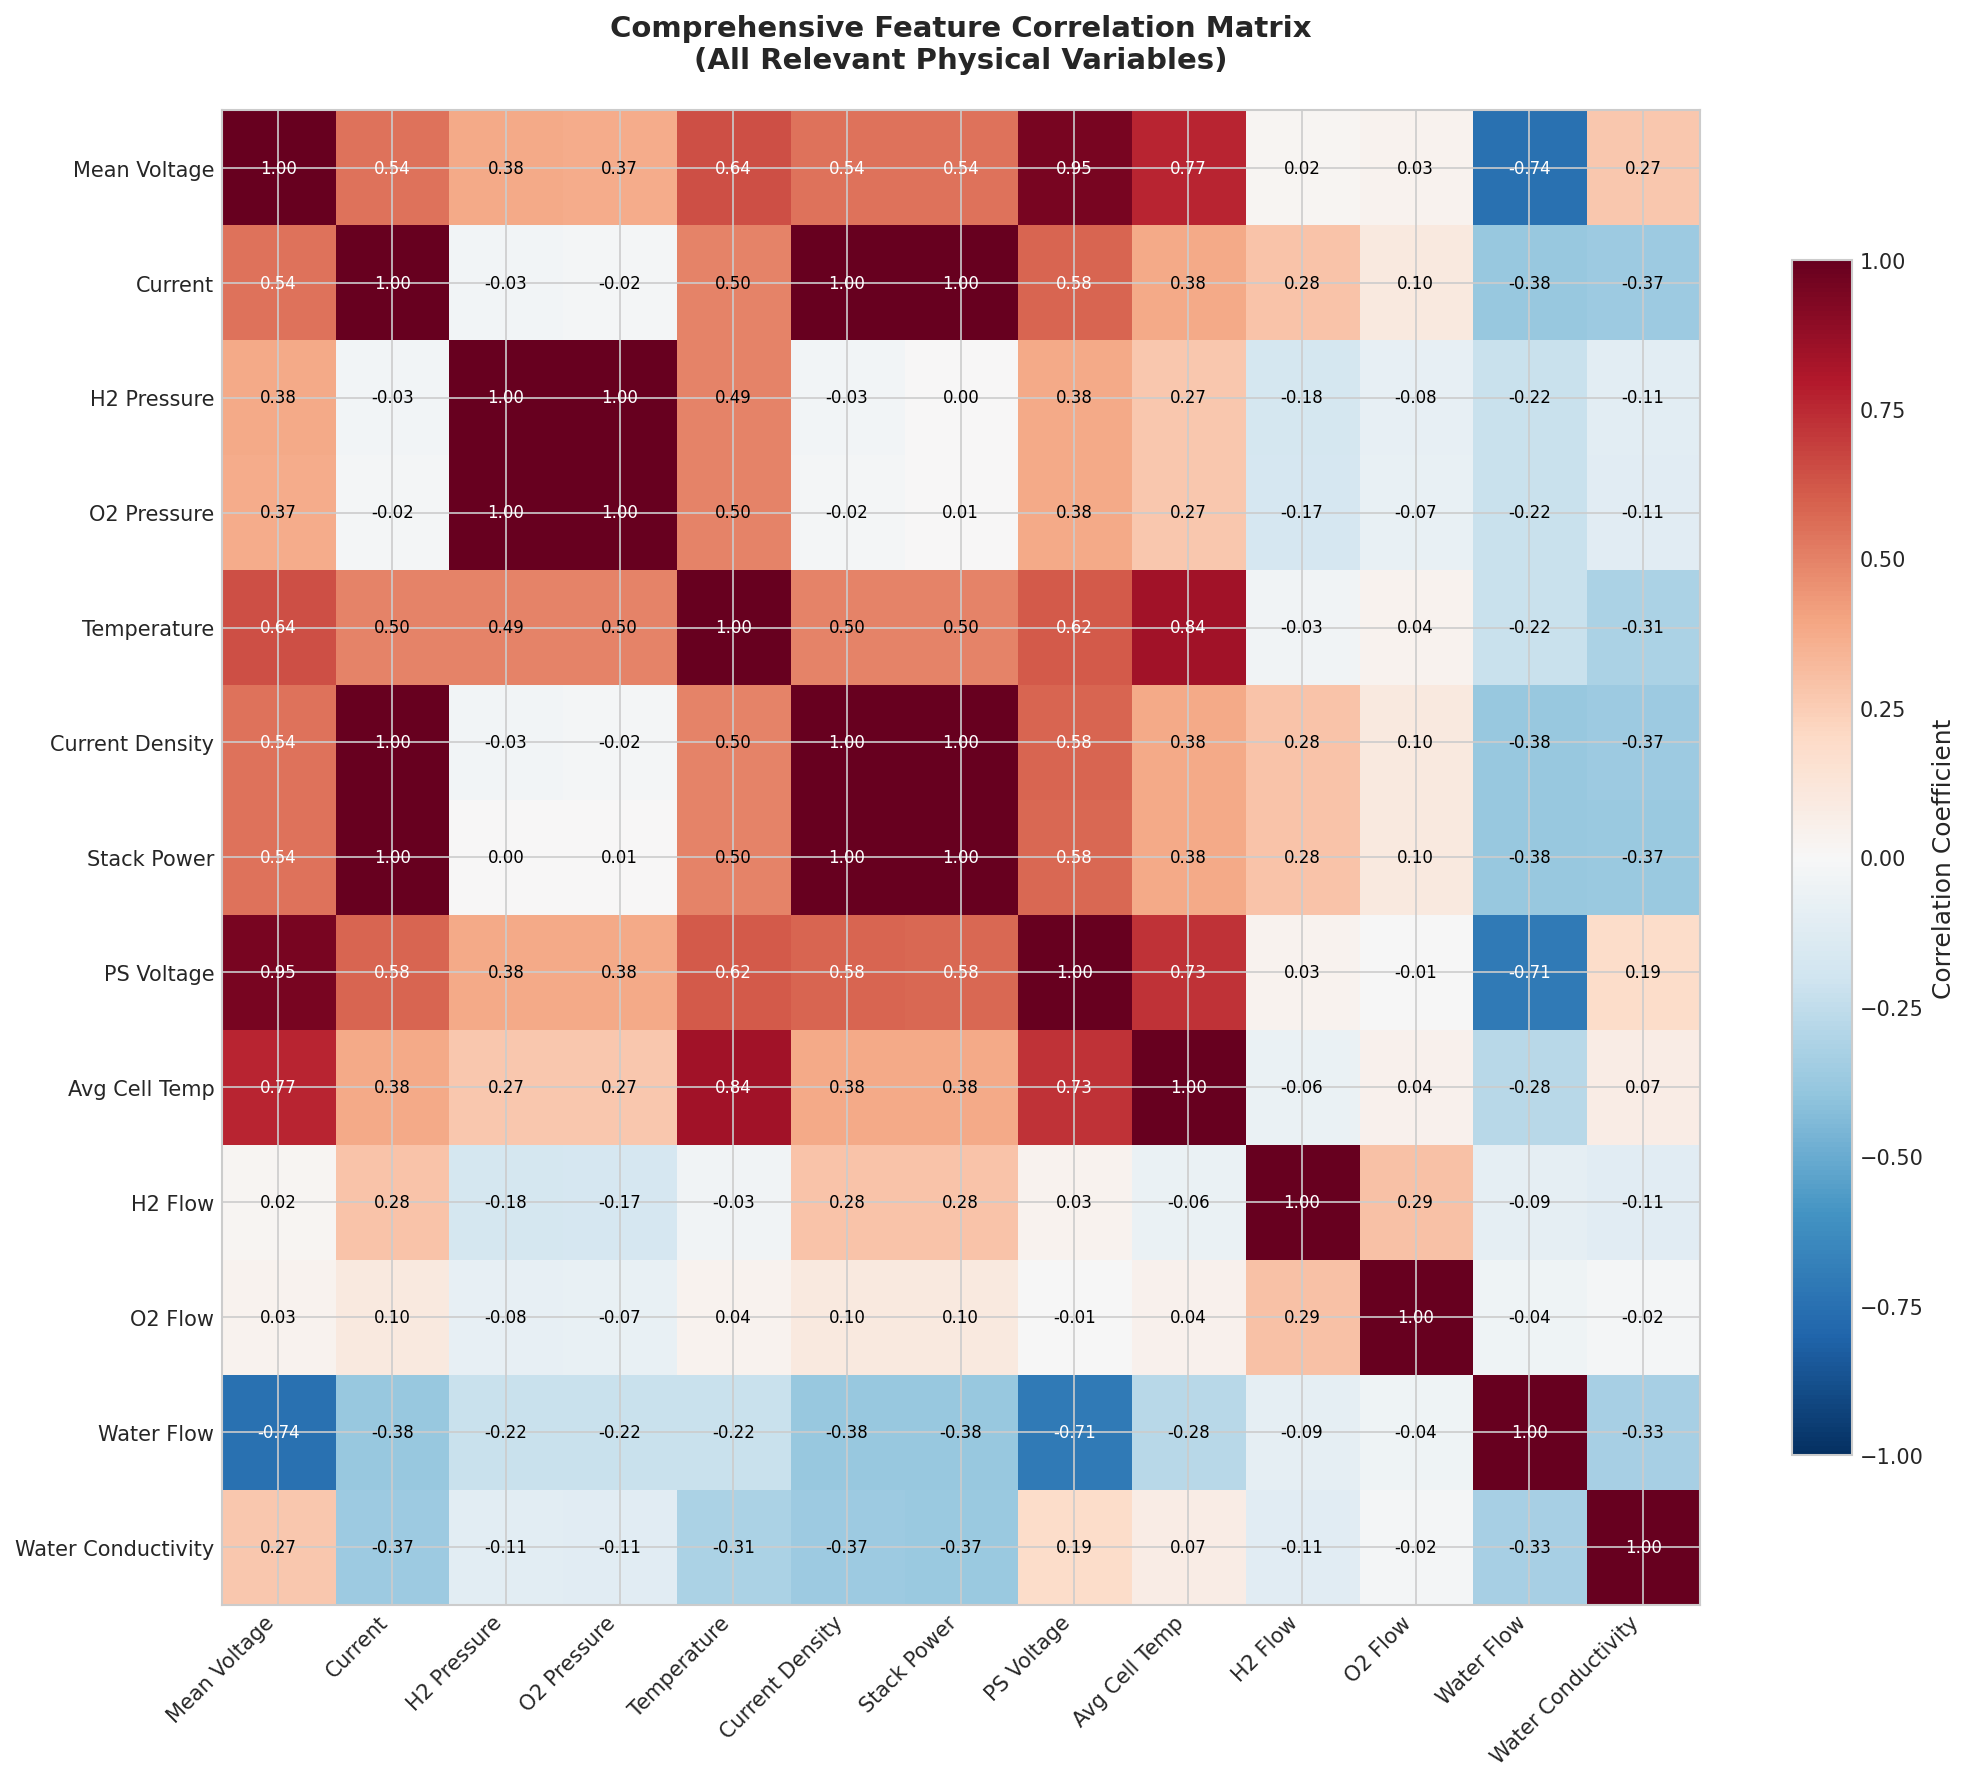
Comprehensive correlation analysis across all sensor channels, revealing the complex multivariate relationships in the electrolyzer data.
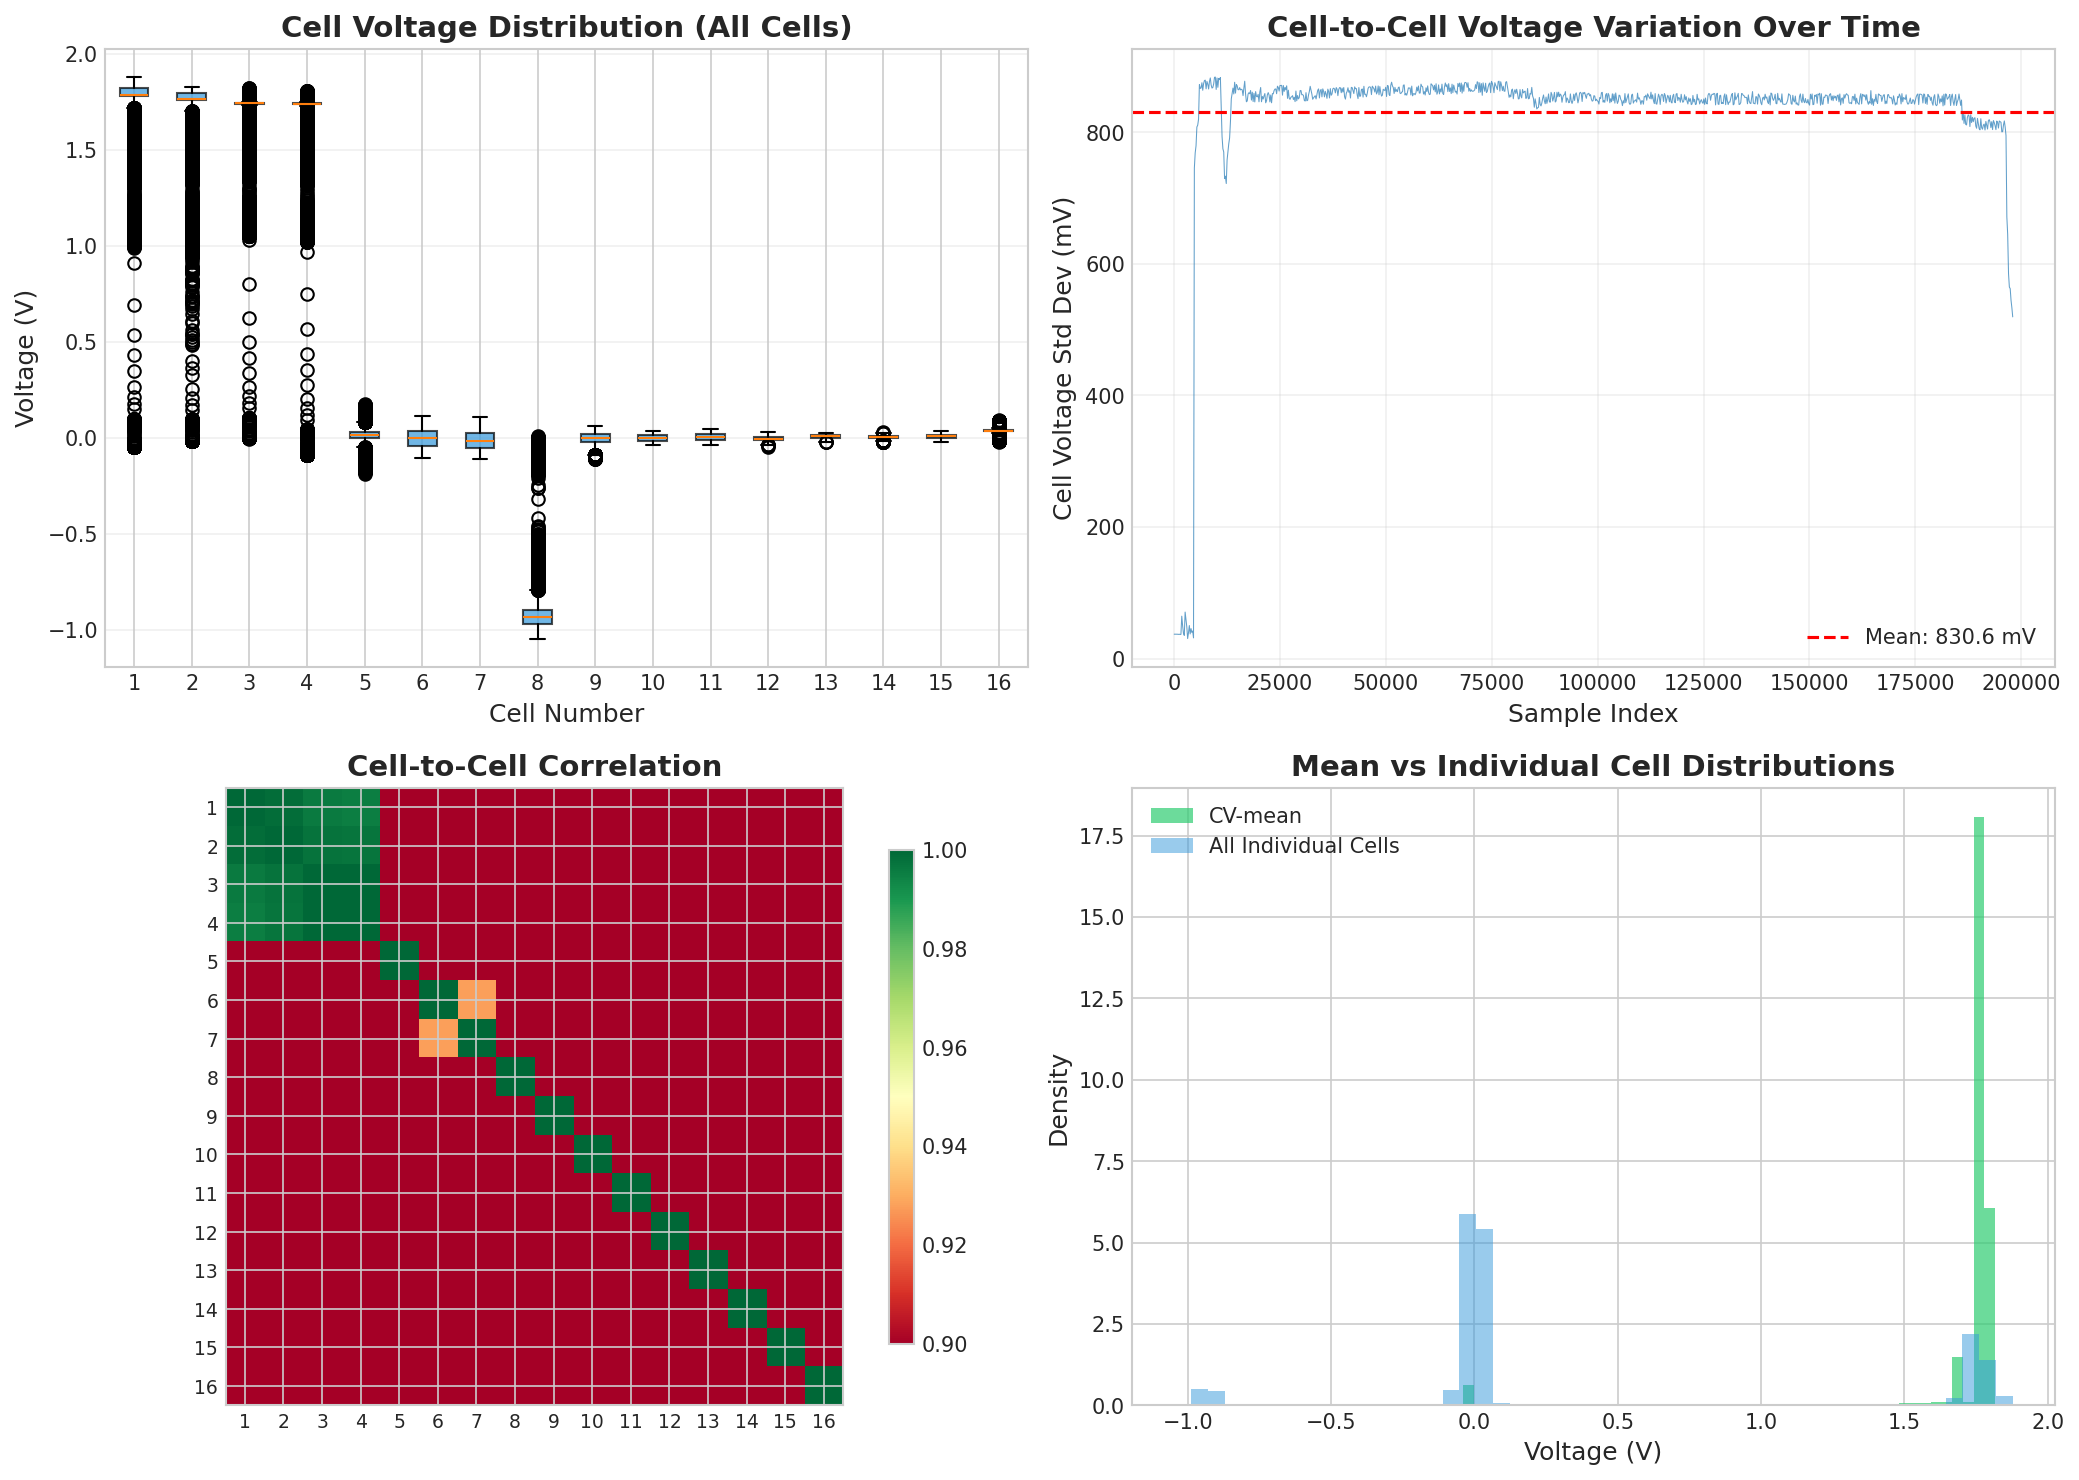
Cell-to-cell voltage analysis from the 4-cell stack: (Top-left) Voltage distributions per cell. (Top-right) Cell voltage variation over time. (Bottom-left) Cell-to-cell correlation matrix. (Bottom-right) Mean vs individual cell distributions.
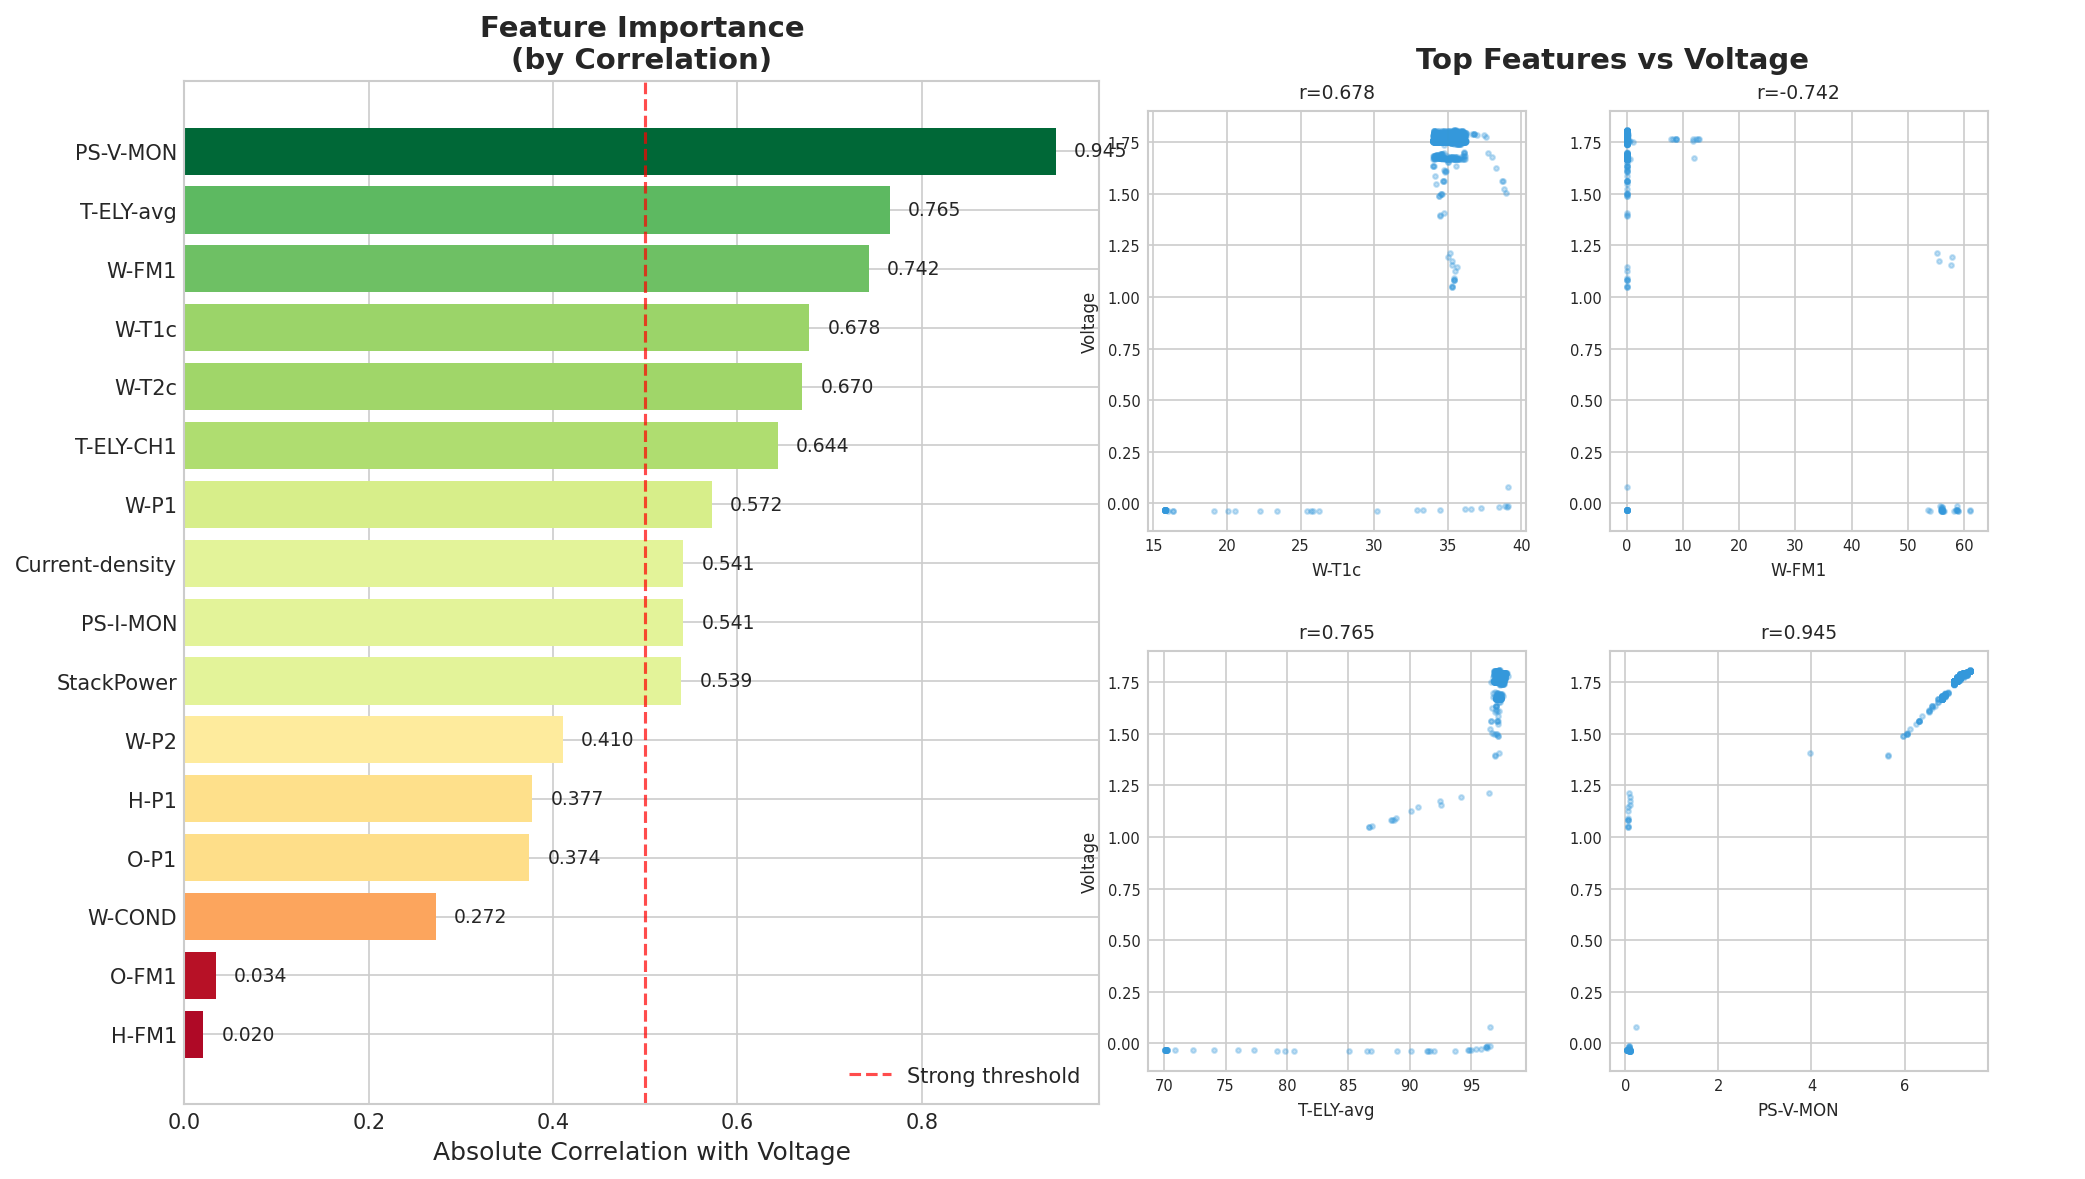
Feature importance ranked by absolute correlation with voltage. The top features (PS-V-MON, T-ELY-avg, W-FM1) have the strongest predictive power, guiding feature selection for the model.
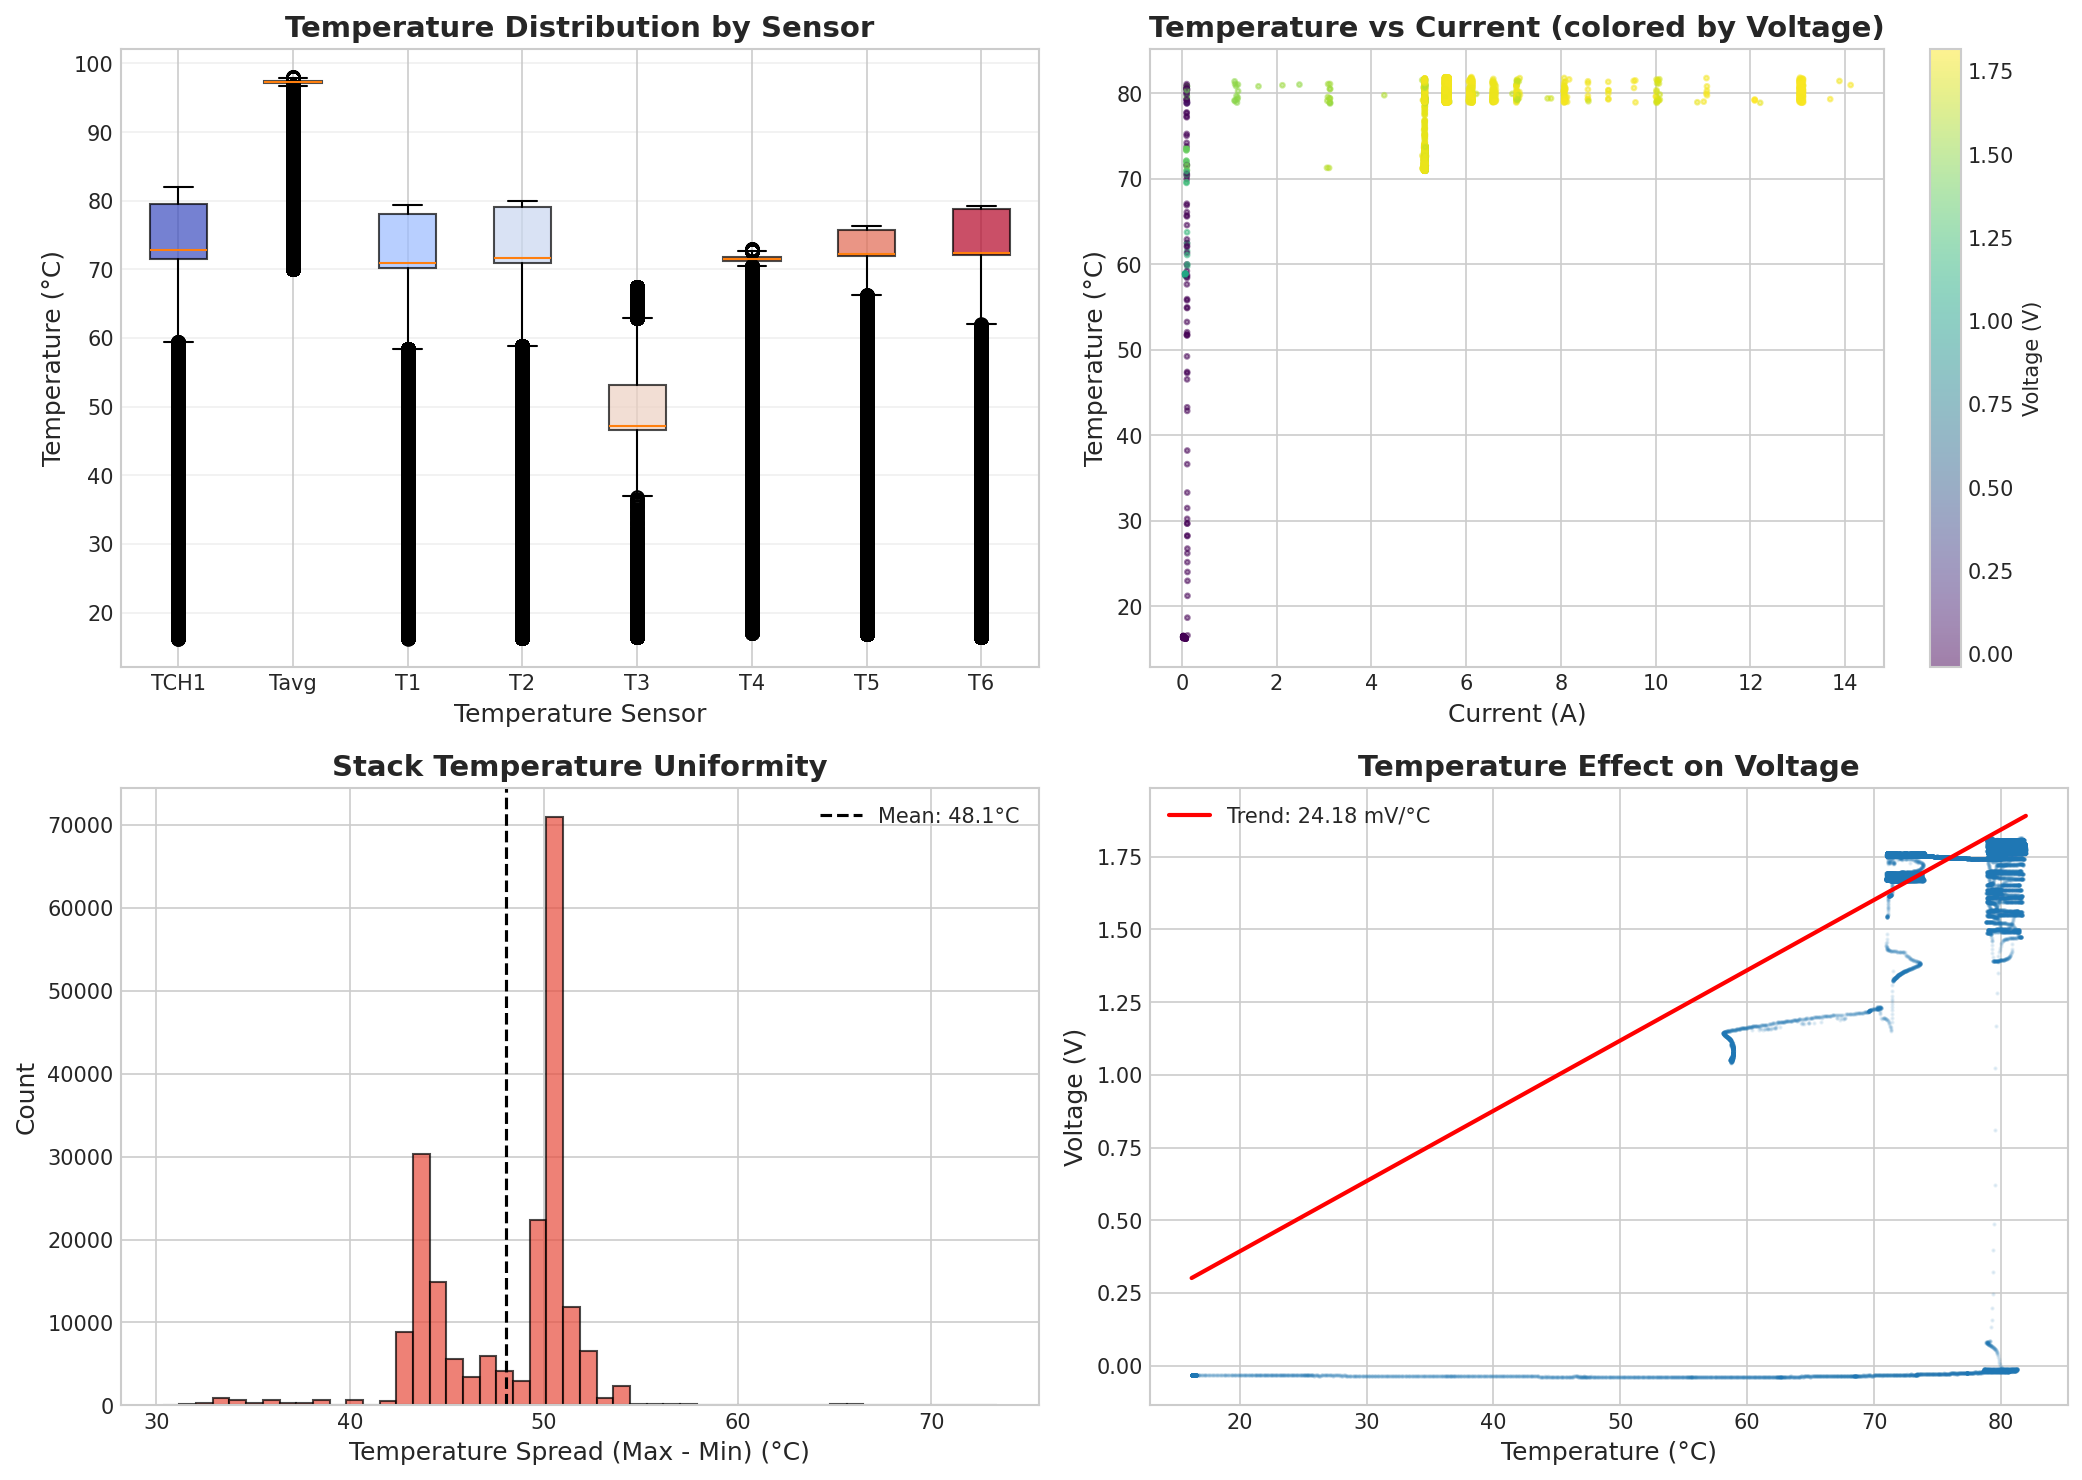
Temperature analysis showing how voltage varies with temperature at different operating points. Higher temperature generally reduces voltage, improving electrolyzer efficiency.
Keep-Out Validation
For training, a temperature-based keep-out validation split is used:
Training: T < 76°C OR T > 80°C
Validation: 76°C ≤ T ≤ 80°C
This forces the model to interpolate to an unseen temperature range, which is critical for OOD generalization.
Keypoints
SWVF technology differs from liquid-fed PEM — explains higher ohmic resistance
Data from NORCE Bergen: Proton OnSite M400 stack (50 cm² active area, 4 cells)
Three test campaigns: Test4 (training, ~172K samples), Test2/Test3 (OOD evaluation)
STRICT filtering for training (7.9% pass rate), MINIMAL for evaluation
Low-pressure regime (< 10 bar) is entirely absent from training data
Keep-out validation (76-80°C) is critical for OOD generalization
H₂ and O₂ pressures are kept separate for correct Nernst equation